Statistics and database
Statistics
Open the statistics from the chart button next to the menu button, or from the menu. They always show the active profile’s own answers. Use ← Back or Esc to return to the page you came from.
Filters
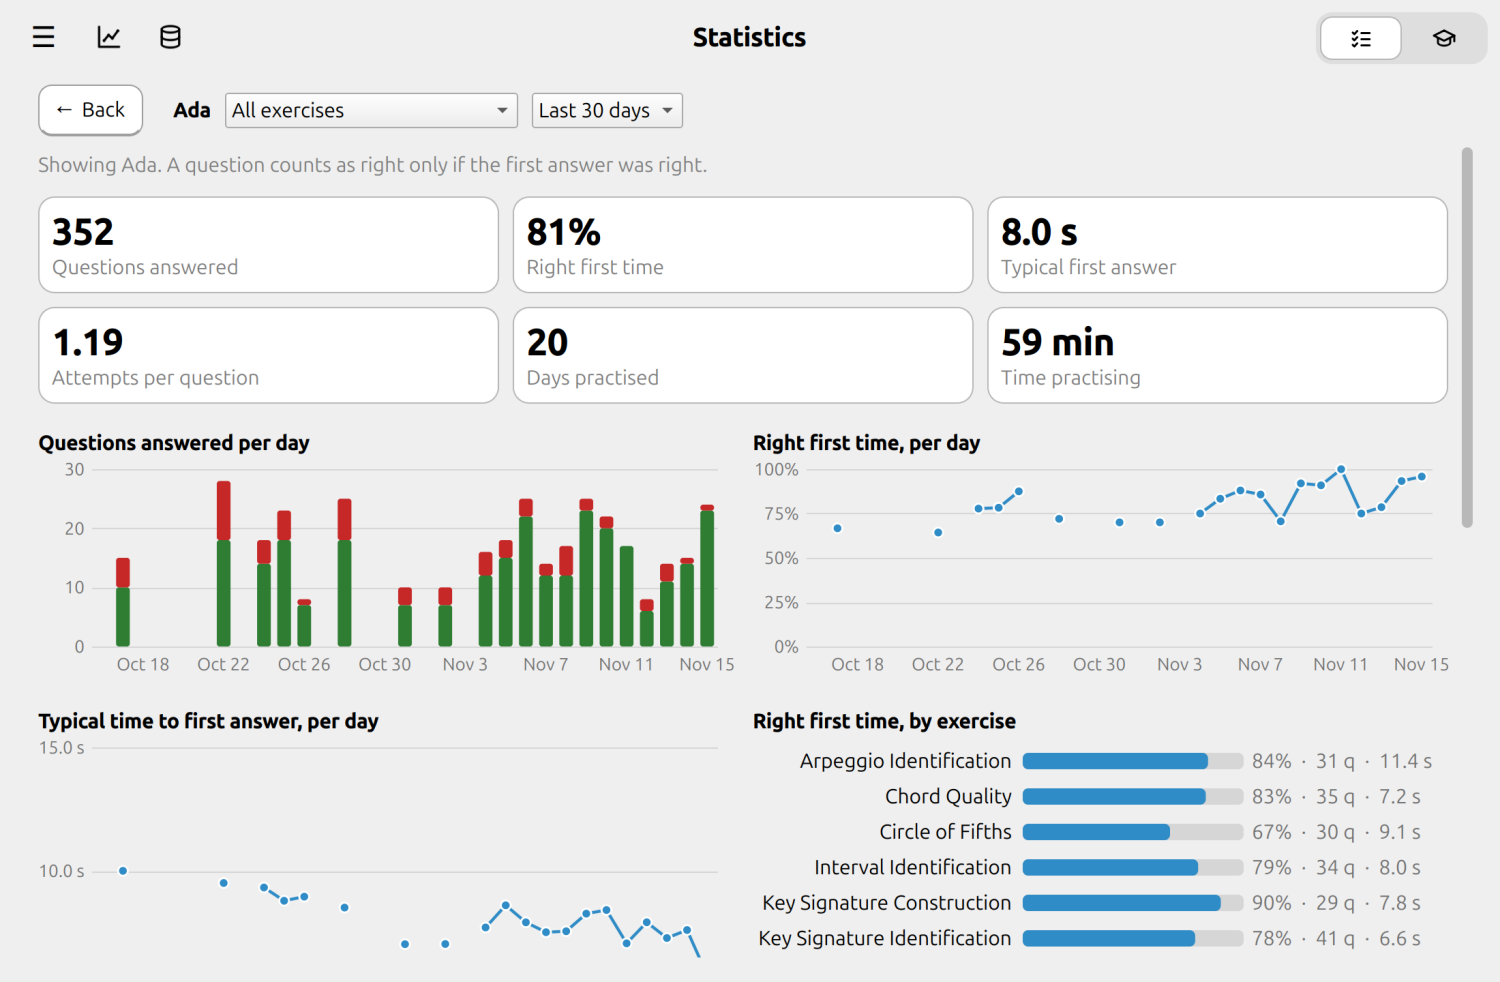
- Exercise: all exercises, or any one of them.
- Timeframe: today, the last 7, 30 or 90 days, the last year, or all time.
What you see
- Summary tiles: questions answered, how often the first answer was right, the typical time to a first answer, attempts per question, days practised, and time spent practising. A single answer counts for at most two minutes of practice time, so leaving the app open does not inflate it.
- Questions answered: a bar per day, with the questions you got right first time in green and the ones you missed in red. Short timeframes switch to hours, and long ones to weeks or months.
- Right first time: your first-try accuracy over time. Days with no answers leave a gap.
- Typical time to first answer: the median, over time, so a single slow answer does not distort it.
- By exercise: accuracy, number of questions and typical time for each exercise.
- Reviews: a calendar of the last 12 months, a square per day (weeks run left to right, Monday at the top), darker the more questions you answered. Hover a square for the exact count. It follows the exercise filter but ignores the timeframe.
- Questions that need practice: the questions with the highest strain, how often you missed them, and how many times you have answered them.
Pointing and clicking
Every chart responds to the pointer. Hover a bar, a point, an exercise row or a calendar day and it brightens while the rest of the chart fades back, with its numbers in a tooltip. Click one and the answers behind it are listed in a panel under the charts:
- a bar or a point of the three charts over time lists the answers given in that period (a day, a week, an hour, depending on the timeframe);
- a row of the by-exercise chart lists the answers to that exercise within the timeframe;
- a square of the calendar lists the answers given on that day.
The clicked element stays bright and the rest stay faded while the panel is open. Click it again, or press Close, to put the panel away; it also closes when you change the exercise or the timeframe, because its numbers would no longer match. Periods and days with no answers cannot be clicked. The list has the same columns as the database browser below, sorts when you click a heading, and double-clicking a row previews the question. It shows the newest 500 answers, and says when there are more.
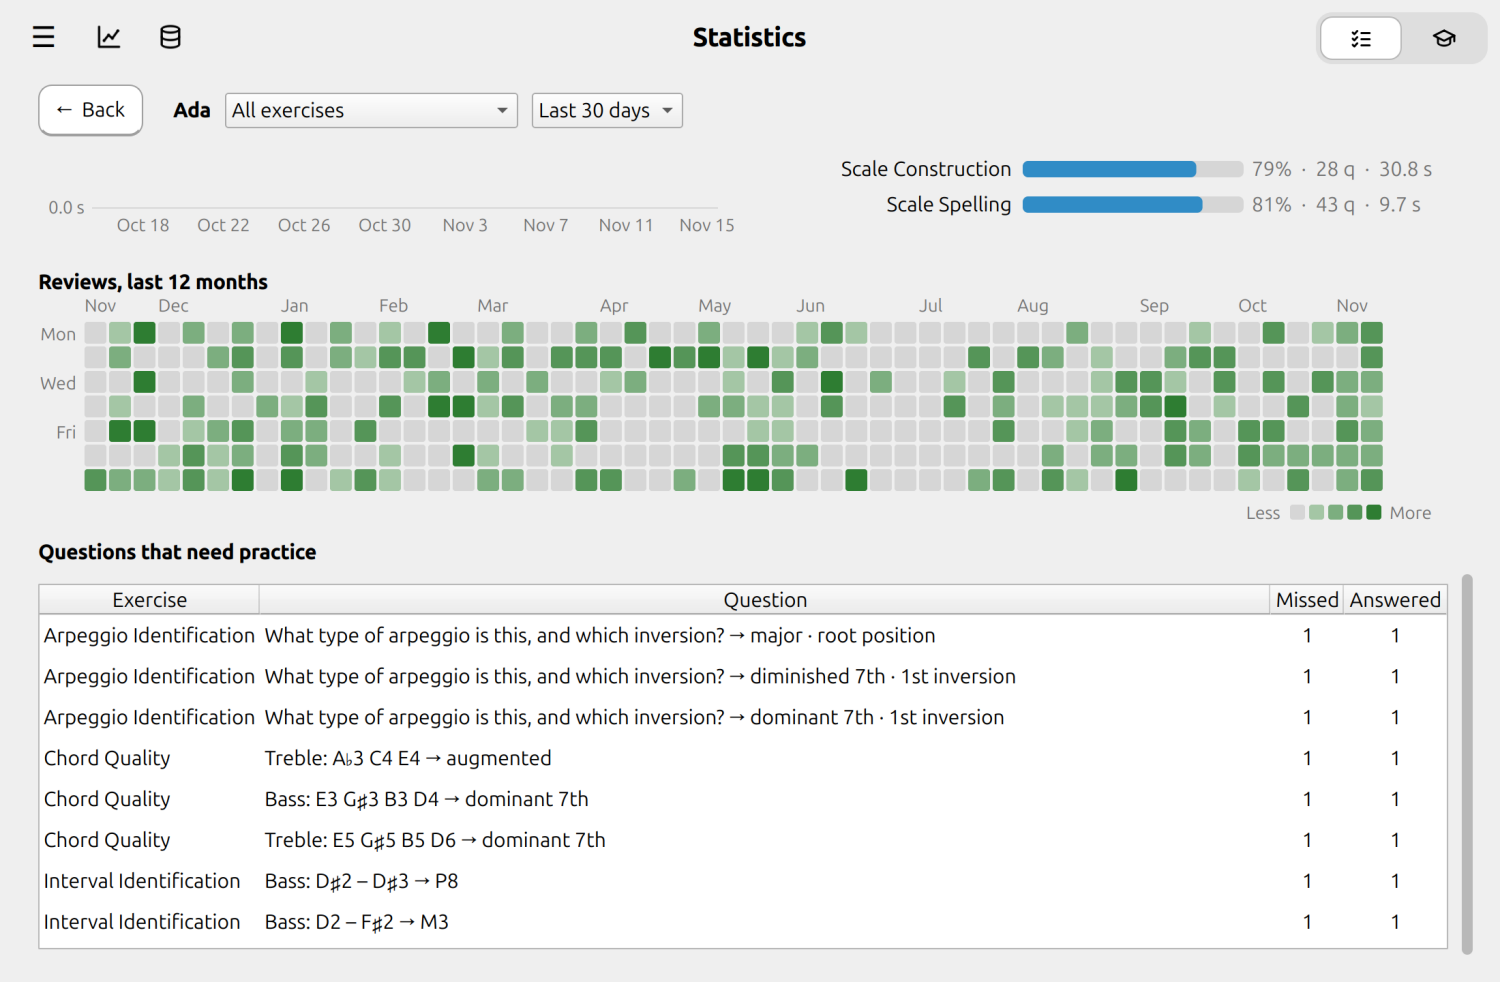
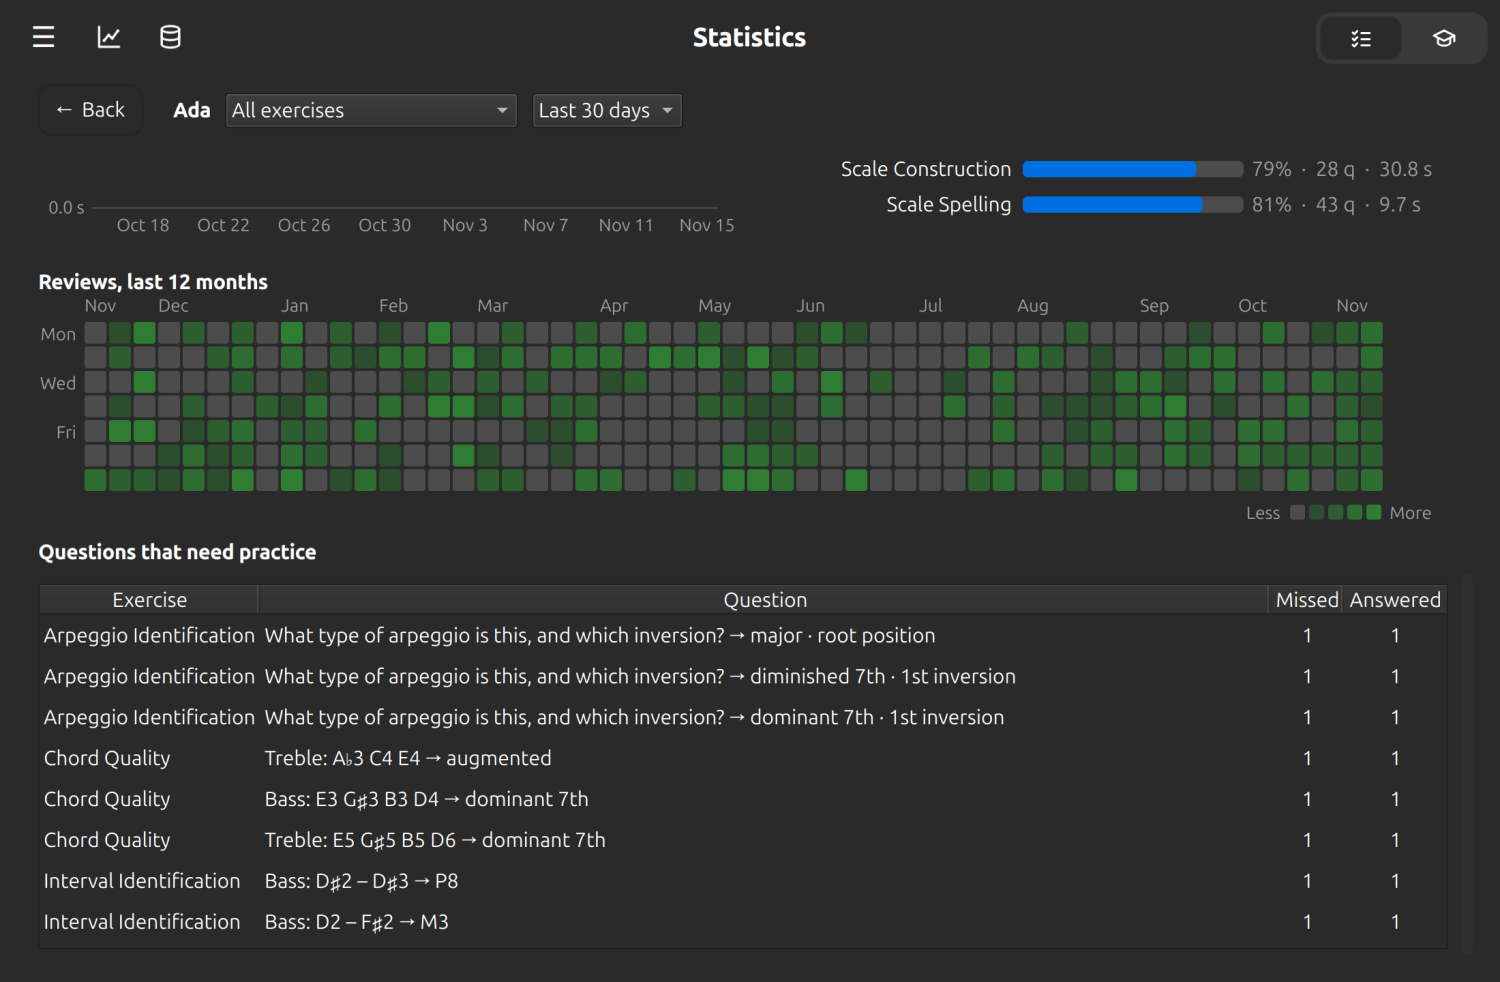
A question counts as right only if your first answer was right. That is the same rule the practice scheduler uses, so the numbers match what Alto thinks about your progress.
Browsing the database
The database button next to the statistics button opens a read-only view of what is stored. It never changes anything.
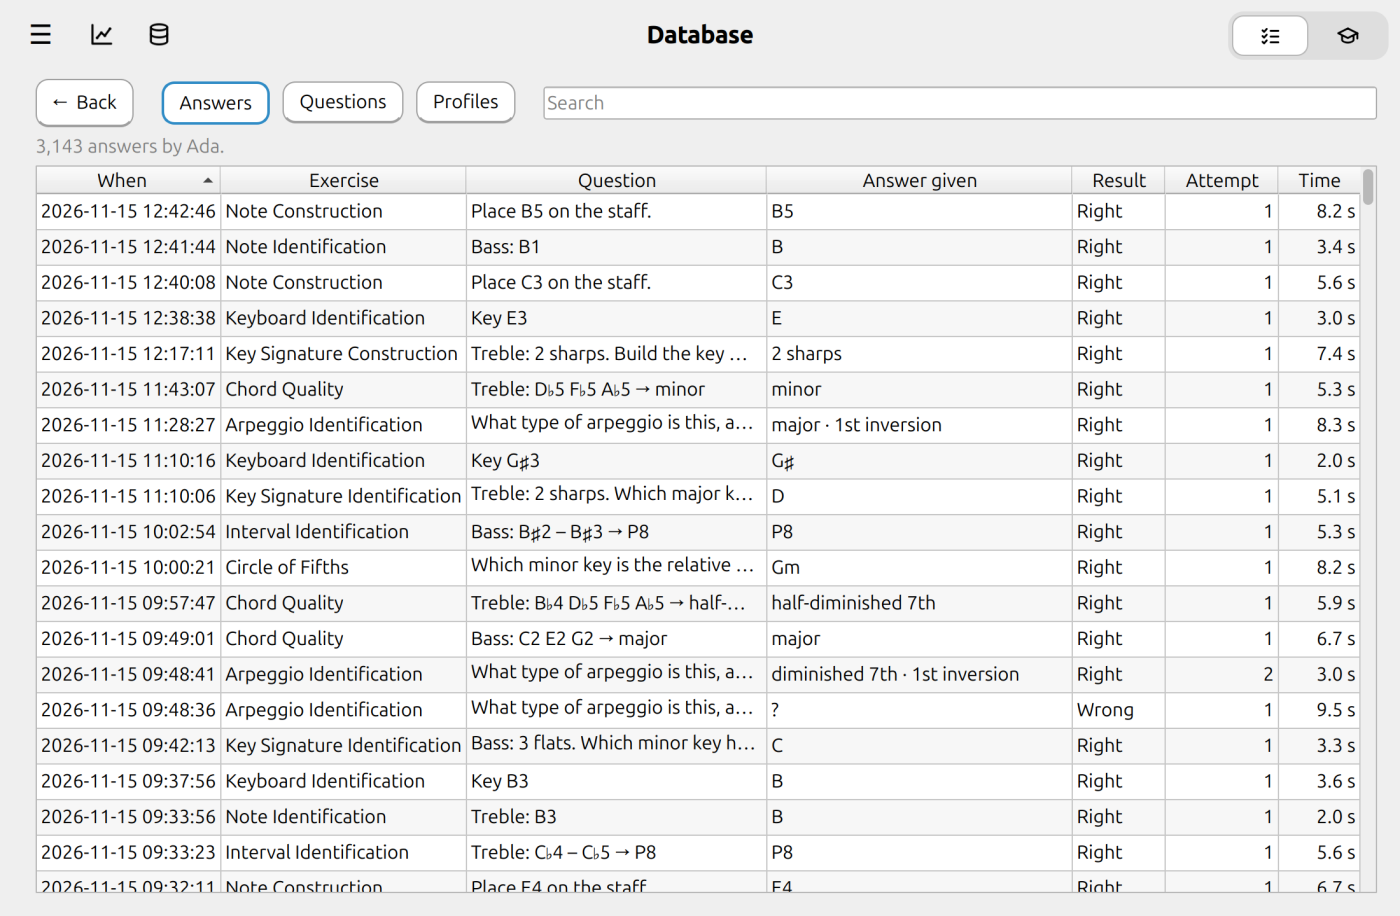
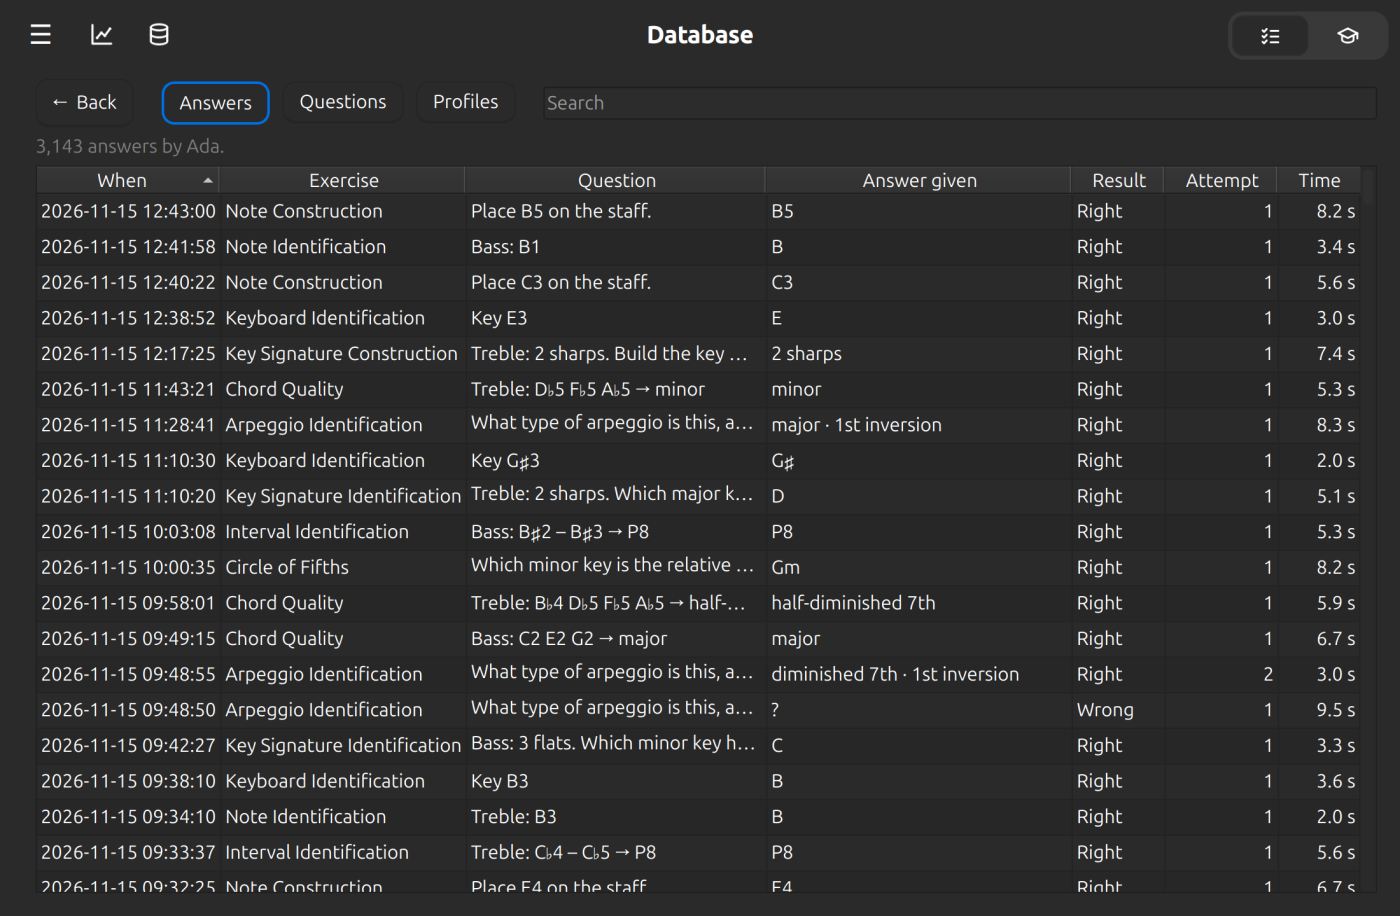
Three tables are available:
- Answers: every answer the active profile has given, newest first, with the question, your answer, whether it was right, the attempt number and the time.
- Questions: the record kept for each question: its strain, how often it was answered, right first time, missed, typical time and when it was last seen.
- Profiles: everyone who has a profile, with how many answers and questions each has.
Click a column heading to sort, and use the search box to filter every column at once. Answers and questions are limited to the newest 10,000 rows each; the line above the table says when that applies.
Previewing a question
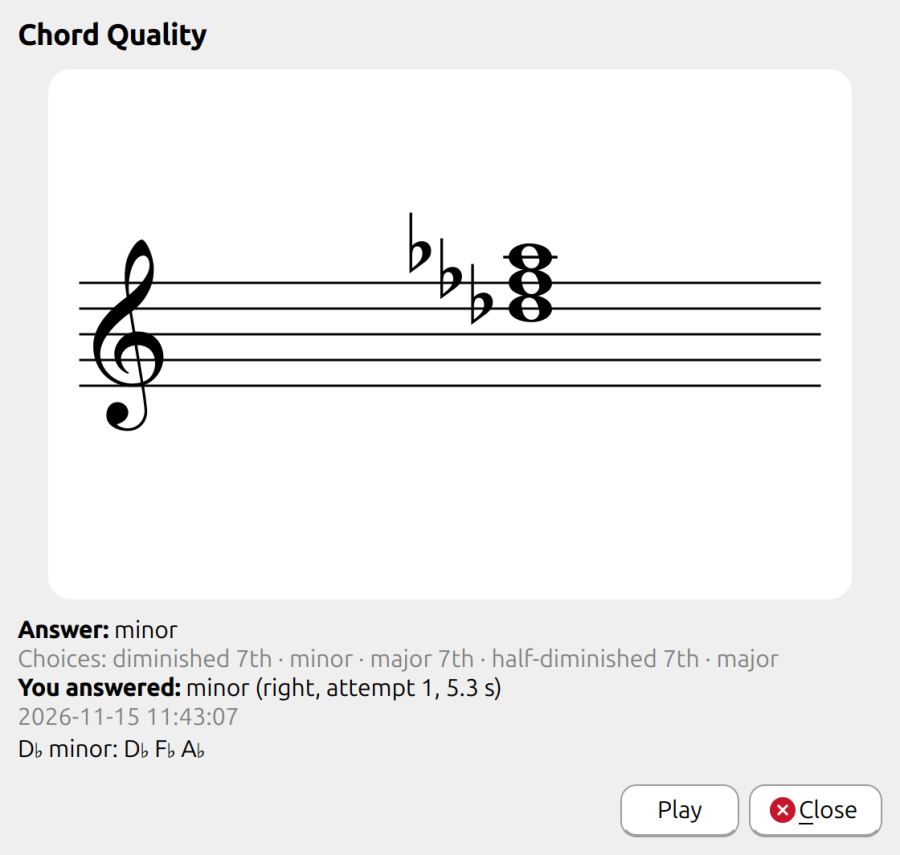
Double-click a row in Answers or Questions to see that question as the exercise showed it, with its answer.